This week, the State of Massachusetts just launched a new dashboard to track the progress of greenhouse gas emission reductions and related indicators. The Massachusetts Global Warming Solutions Project (GWSP) Network has been working with the state to develop a meaningful set of metrics to enable progress to be evaluated. 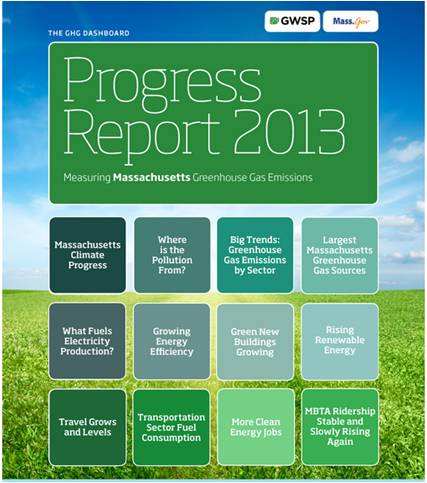 While many state and local governments have set greenhouse gas (GHG) emission reduction goals and issued climate action plans for how to achieve the goals, too often these plans do not translate into sustained action on the ground. Measuring progress and sharing this publicly is key to ensure follow through on these commitments and determine whether GHG emissions and associated indicators are moving in the right direction. A clear focus on data and results offers a common basis for leaders in state government and concerned stakeholders to ensure the state achieves its goals, tracks its progress and takes remedial actions if needed.
The Massachusetts dashboard provides an overall measure of GHG emission reductions (estimated at about 10% since 1990, with a goal of 25% by 2020.) In addition, it provides data and graphs on about a dozen other indicators that relate to reducing GHG’s, such as percent of renewable energy and public transit use. Another benefit of this type of dashboard is that it provides a shared understanding of the activities and trends that affect the overall GHG number, e.g., electricity use, transportation, buildings.
New Directions Collaborative has been working with the GWSP Network and helped facilitate meetings that brought the diverse perspectives of network members together to determine what metrics of progress would be useful. These conversations continued with the state to determine how to track progress in ways were relevant and meaningful to stakeholders. Here are some of the criteria that were considered in selecting metrics, e.g., metrics that:
• Are based on data that is already collected or can readily be gathered and updated
• Have clear links to policy or other behaviors
• Are of interest to state agency staff and to advocates and other key stakeholders
• Resonate with the public
In a related development, Environment Northeast (ENE) just issued Climate Vision 2020, an on-line dashboard of evaluating the progress of eight Northeast states on their climate emission goals. It provides an assessment of progress, data on emission trends, sector spotlights, policy successes, and a look forward at areas for future strategic focus.